Global Climate Signal Maps
In order to support decision-making regarding climate change adaptation, the GERICS-Climate Signal Maps combine two pieces of information. On the one hand, they help to identify regions with robust projections of future climate change, thereby tackling the issue of uncertainty of future climate development. On the other hand, they highlight regions, for which projected climate changes are strongest, thereby addressing the issue of awareness rising.
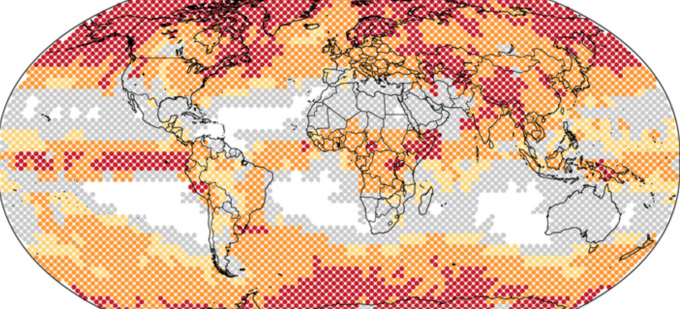
For the identification of robust climate changes from a large number of climate change simulations, both, the agreement of various climate model results in the direction of change (e.g. wetter or drier, warmer or colder) and the statistical significance of the projected change of the individual model simulations, are assessed and both results are combined. All regions with non-robust changes are greyed out in the map.
 – (1971-2000)")
Example: Increase in the frequency of extremely wet days. Difference (2036-2065) – (1971-2000)
Robustness is derived from a threefold test:
1. statistically significant difference
2. model agreement on direction change
3. insensitivity to small shifts in time periods
Examples for global Climate Signal Maps