Global Climate Signal Maps in Detail
Climate Signal Maps are intended to provide easy understandable information about the robustness of projected climate change.
The method is described in the following paper:
Robustness of Ensemble Climate Projections Analyzed with Climate Signal Maps: Seasonal and Extreme Precipitation for Germany
Examples for global Climate Signal Maps
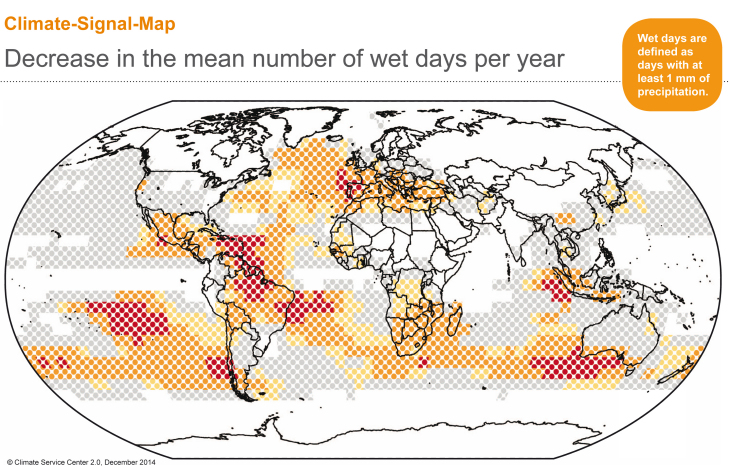 Decrease in the mean number of wet days per year (5,5 MB)
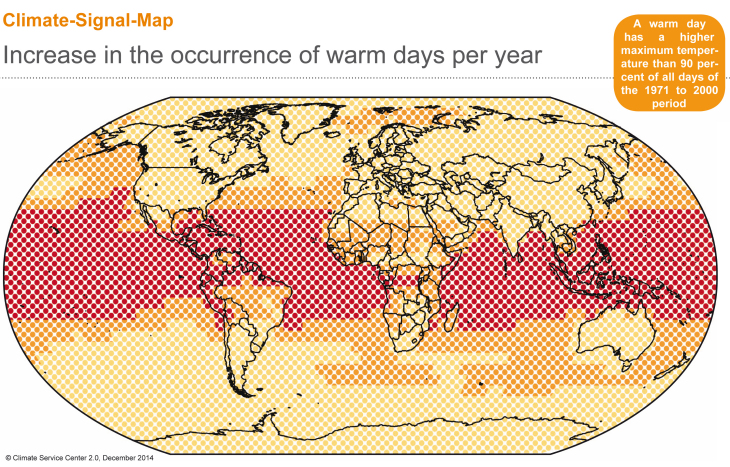 Increase in the occurrence of warm days per year (6,6 MB)
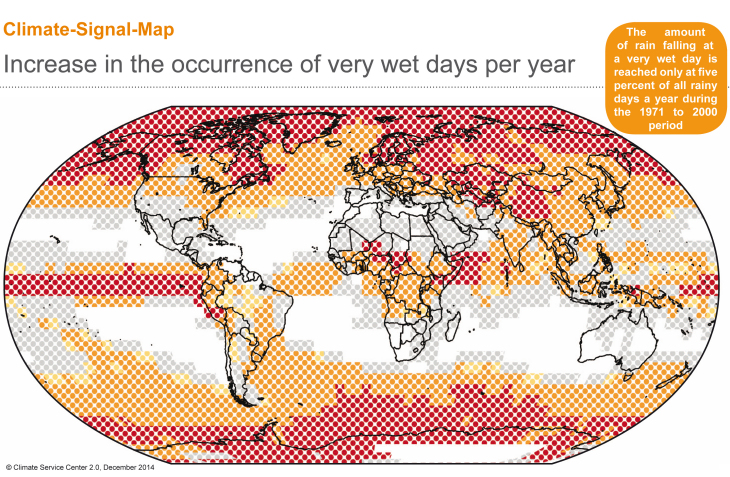 Increase in the occurrence of very wet days per year (6,9 MB)
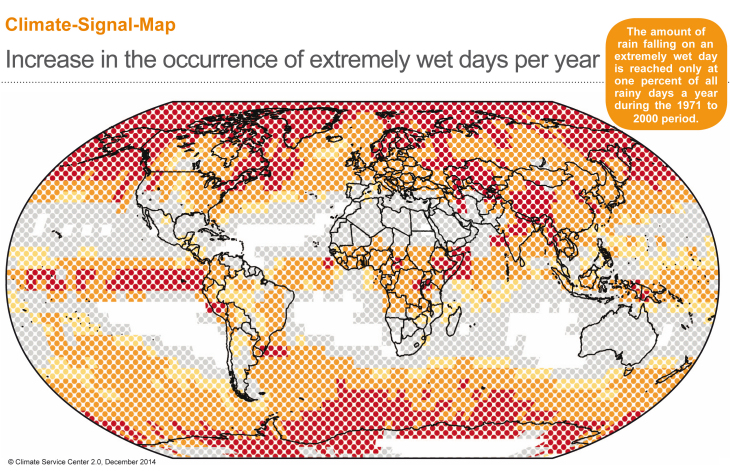 Increase in the occurrence of extremely wet days per year (7,2 MB)
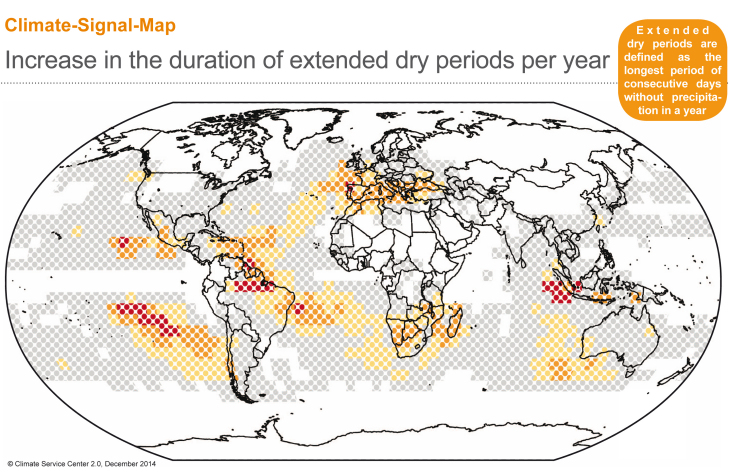 Increase in the duration of extended dry periods per year (5,3 MB)
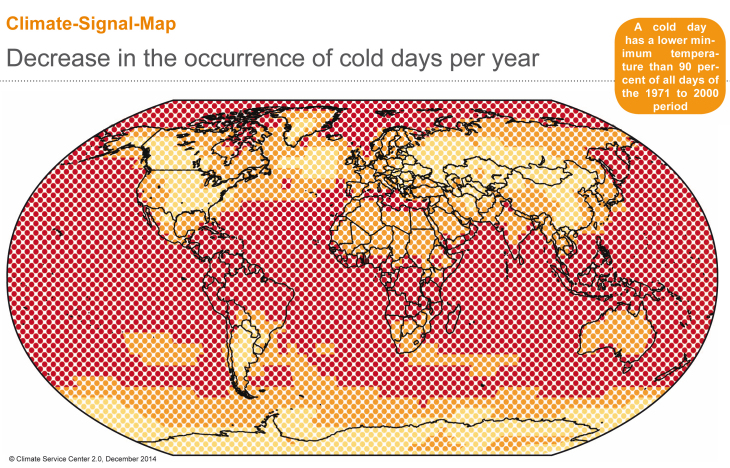 Decrease in the occurrence of cold days per year (7,4 MB)
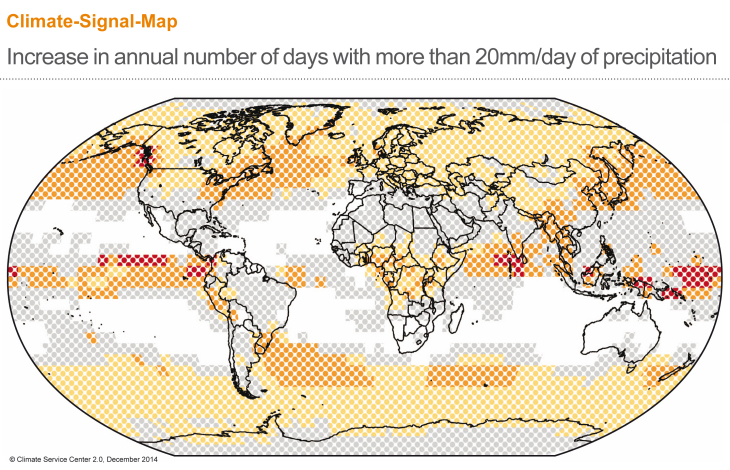 Increase in annual number of days with more than 20mm/day of precipitation (6,0 MB)
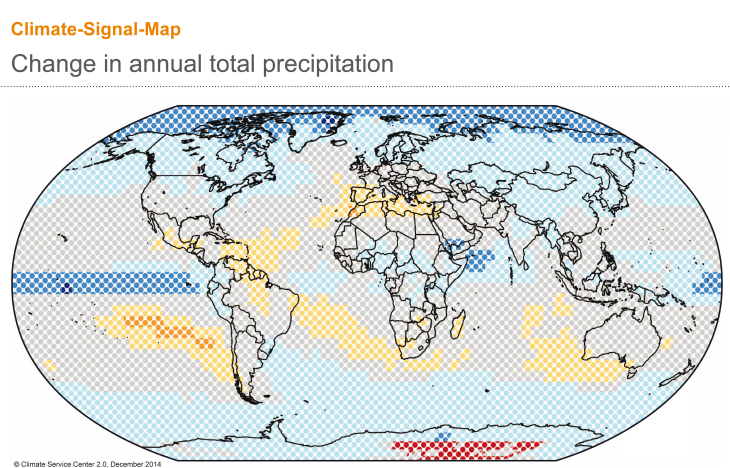 CSM annual total precipitation (2,0 MB)