GERICS Regional Modelling Toolkit (Regionaler Modellierbaukasten)
Currently, the Regional Modelling Toolkit is under development, which will allow to analyse the impacts of climate change in a region. The size of the region that will be investigated can range from continental scale to the size of the city. By applying the Regional Modelling Toolkit, the essential components in a region are simulated and linked with each other. These components also include human factors. Examples are cities, soils, forests or entire ecosystems and land-use.
The Regional Modelling Toolkit provides decision support in identifying the essential components and their interaction, representing a region in an appropriate way. The choice of the analysis method in order to describe a particular component depends on the location, the size and the nature of the region as well as on the respective problem. Accordingly, analysis methods can be numerical methods as well as simplified models, but also data or other tools.

Figure 1: Schematic representation of the Regional Modelling Toolkit. The various shapes represent different components, the colours symbolize different analysis methods. The dashed line frames the components of a “model group”.
© GERICS
A schematic representation of the Regional Modelling Toolkit is shown in Figure 1. Different components and analysis methods are represented by coloured symbols: The various shapes represent different components (e.g., soils or forests). The various colours indicate different analysis methods to represent the components in a model. The arrows between the figures indicate the interaction between the components.
The representative components depend on the region and on the individual problem that is addressed. Sometimes, even a single component is sufficient, e.g. when a city is represented in a regional model only by its land surface properties. In complex cases, a whole “model group” is necessary. In the example of the city, e.g., the heat island effect or pollutant emissions can be additionally taken into account. This affects also the interactions between the components.
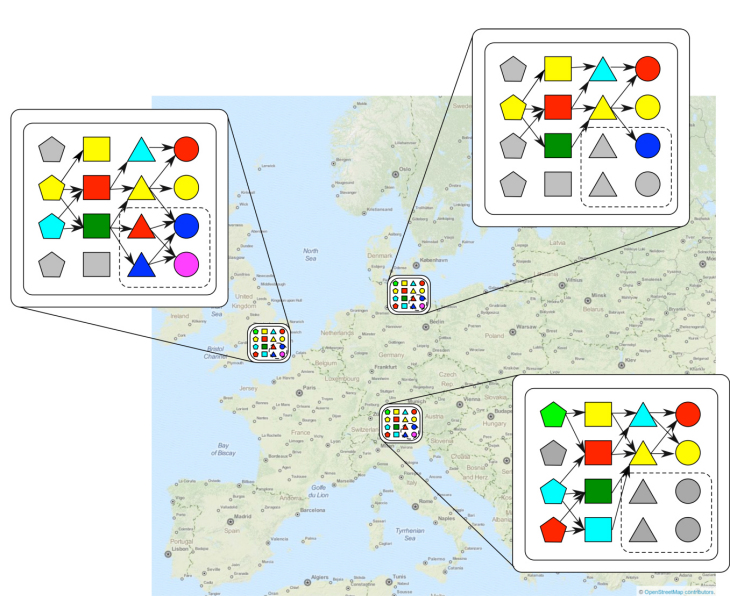
Figure 2: Different applications of the Regional Modelling Toolkit exemplary for three individual regions in Europe.
© openstreetmap.org/GERICS
Figure 2 illustrates different applications of the Regional Modelling Toolkit for three individual regions: 1) Greater London; 2) A region around the city of Kiel located at the Baltic Sea coast; and 3) A rural alpine area.
In example 1) Greater London, the component “city” is represented by a model group. To adequately represent the Greater London region, all components and analysis methods of the model group “city” are required. 2) For the region at the baltic sea coast, only one component of the model group is necessary. 3) In the case of the rural Alpine region the model group “city” is not needed at all to adequately represent the region. Here, other components are needed.
In addition to the selection of the model components and their interaction, the Regional Modelling Toolkit indicates limits and uncertainties with respect to the analysis using the created model of the region. The Regional Modelling Toolkit contributes to the sustainable management of a region including climate change.